In the world of trading, a “tick” is a basic concept. Yet, many new traders might not fully understand what it means. A tick plays an important role in the stock market, futures trading, and other financial markets. It represents the smallest possible price movement of a trading instrument. Knowing how ticks work can help traders make better decisions.
What Is a Tick?
A tick is the smallest increment by which the price of a financial asset can move up or down. For example, if a stock price goes from $10.00 to $10.01, the difference is one tick. The value of a tick can vary depending on the trading instrument. For stocks, a tick is often equal to one cent. For futures and other assets, the tick size is predefined by the exchange where the asset is traded.

Tick Size vs. Tick Value
It is important to understand the difference between tick size and tick value. Tick size is the smallest unit of price movement. Tick value, on the other hand, refers to how much money a tick is worth. The tick value depends on the size of the contract. For instance, in crude oil futures, one tick equals $0.01 per barrel. If a futures contract represents 1,000 barrels, the tick value is $10 ($0.01 x 1,000).
Why Do Ticks Matter?
Ticks provide traders with crucial information. They help track price changes in real time. By observing tick movements, traders can identify trends and patterns. This is especially important in short-term trading strategies, such as day trading or scalping. A small tick can signal big opportunities or risks for a trader.
Ticks also play a role in market liquidity. A highly liquid market will often have small tick sizes. This allows prices to move more smoothly. In contrast, illiquid markets might have larger tick sizes, making price movements less frequent but more significant.

Types of Ticks
Ticks can be categorized based on the direction of price movement.
- Up Tick: This happens when the price of an asset increases compared to the previous trade.
- Down Tick: This occurs when the price decreases compared to the last trade.
- Zero Tick: This is when the price remains unchanged from the last trade.
These movements are vital for understanding market behavior. Traders often use tick charts to visualize these changes.

Tick Charts
A tick chart is different from a regular time-based chart. In a tick chart, each bar represents a specific number of transactions, not time. For example, a 200-tick chart will show a new bar every 200 trades. Tick charts are popular among day traders. They provide a clearer view of market activity, especially during fast-moving markets.
Tick charts can also help traders avoid noise. Time-based charts may show many unnecessary price movements during slow market periods. Tick charts, however, only show activity when there is trading volume.

Ticks in Different Markets
The importance of ticks varies between markets.
- Stock Market: In stock trading, the minimum tick size is typically $0.01. However, this can vary depending on the stock’s price.
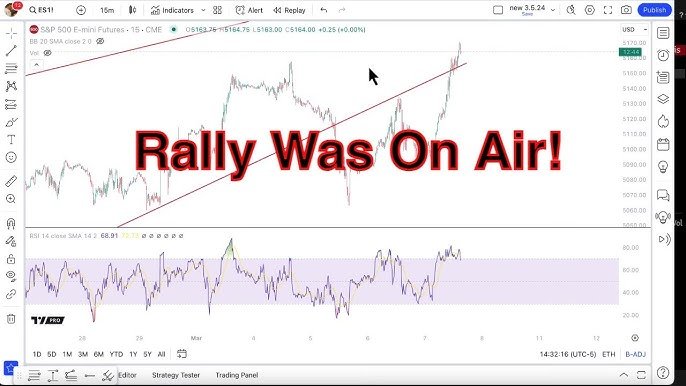
- Futures Market: In futures trading, tick sizes and values are predetermined by the exchange. For example, the E-mini S&P 500 futures contract has a tick size of 0.25 index points, worth $12.50.
- Forex Market: In forex trading, ticks are measured in pips. A pip is the smallest price change for a currency pair.
Using Ticks in Trading Strategies
Ticks can be used in several trading strategies.
- Scalping: Scalpers focus on small price movements, often measured in ticks. They aim to make quick profits from tiny changes in price.
- Breakout Trading: Traders watch tick charts to spot breakout points. A surge in tick volume can signal a breakout.
- Order Flow Analysis: Some traders study ticks to analyze order flow. They look for patterns in buying and selling activity to predict price movements.
Challenges with Ticks
While ticks provide valuable information, they also have limitations.
- Noise: In highly volatile markets, ticks can create too much noise. This can make it harder to spot real trends.
- Overtrading: Watching every tick can lead to overtrading. This happens when traders act impulsively based on minor price changes.
- Lack of Context: Ticks show price movements but not the reason behind them. Traders need to use other tools to understand market context.
Conclusion
Ticks are an essential part of trading. They represent the smallest price movement in a financial market. By understanding ticks, traders can improve their strategies and make informed decisions. However, like any tool, ticks must be used wisely. Combining tick data with other analysis methods can lead to better results. Whether you are trading stocks, futures, or forex, keeping an eye on ticks can give you an edge in the market.


Discussion about this post